The Systemic Racism of the Electoral College, Revisited
December 18, 2023
New York, N.Y.
The concept of one-person-one-vote is central to democracy. No person’s vote should have more power or influence than anyone else’s. In a 1964 case Wesberry v. Sanders, the Supreme Court stated this explicitly: “As nearly as practicable, one man’s vote in a Congressional election is to be worth as much as another’s.” In Reynolds v. Sims the concept was extended to state legislatures. In 1964, Chief Justice Earl Warren wrote “People, not land or trees or pastures, vote.” (These quotes are from a 1986 New York Times article “One Man, One Vote: Decades of Court Decisions”.)
Yet, there is one major American institution that violates the one-person-one-vote principle most egregiously and with greatest harm. What’s worse, it’s how we choose our President every four years. This is the Electoral College.
In the quadrennial election for President of the United States, each state gets a fixed number of electors that is equal to that state’s number of senators (which is always 2) plus the number of members in the House of Representatives, which is based on population and range from 1 (for six low-population states) to 52 (for California). Because of those two extra electors in each state, low-population states have a greater number of electors proportional to population. In most states, the candidate who gets a plurality of the popular vote (that is, more than any other candidate) is awarded all that state’s electors. The only exceptions are Maine and Nebraska, who apportion their electors based on state districts.
The most obvious result of this scheme is that individual voters in small-population states tend to have more power in choosing the President than individual voters in high-population states, and that difference can skew an election. This is not an academic issue: Twice in recent decades — in 2000 and 2016 — the candidate who lost the popular vote became President anyway. Elected officials often fancy themselves “the people’s choice,” but this is not always the case with the President.
What’s worse is that the Electoral College is racially biased. This is an example of systemic (or institutional) racism — racism that is not the result of discriminatory actions by individuals or by legislation that specifically targets particular races, but instead built into the system. Because low-population states demographically tend to have fewer non-White voters that high-population states, the Electoral College gives White voters greater power to choose the President.
Four years ago, I quantified how the Electoral College favors White voters in my blog entry “The Racism of the Electoral College, Mathematically Demonstrated”. That analysis was based on the 2010 census and the number of state electors applicable to the 2012, 2016, and 2020 elections. In this blog entry, I have updated that analysis with population data from the 2020 census and electors applicable for the 2024 and 2028 Presidential elections, and I have discussed my methodology in more detail.
The Handicapping of High-Population States
Article 1, Section 2, of the United States Constitution mandates that a census be held every ten years for allocating each state’s members in the House of Representatives and by extension, the number of electors of the Electoral College. The first census was held in 1790, and those counts became the basis of electoral votes in the 1792 Presidential election. In 1790, the highest population state was Virginia, which had about 12½ times the population of the lowest population state (Delaware). The number of electors for each state ranged from 3 to 21.
The penalization of high-population states by the Electoral College has worsened over the past two centuries. Today, the largest population state (California) has over 68 times the number of people in the least populated state of Wyoming, and the number of state electors now ranges from 3 to 54.
Here’s a table showing the 50 states plus the District of Columbia with their populations from the 2020 census. The fourth column shows the number of electors applicable for the 2024 and 2028 Presidential elections. (I’ll discuss where the census figures come from shortly; the number of electors are from a page on the National Archives site.) For each state, the penultimate column shows the number of Electors per Million of Population. The final column shows the Relative Electoral Strength of the voters in each state; this is obtained by simply dividing each state’s Electors per Million of Population by that value for the United States as a whole:
| State | Population | Percent of Total | Electors | Electors per Million of Population | Relative Electoral Strength |
|---|---|---|---|---|---|
| Alabama | 5,024,279 | 1.52 % | 9 | 1.79 | 1.10 |
| Alaska | 733,391 | 0.22 % | 3 | 4.09 | 2.52 |
| Arizona | 7,151,502 | 2.16 % | 11 | 1.54 | 0.95 |
| Arkansas | 3,011,524 | 0.91 % | 6 | 1.99 | 1.23 |
| California | 39,538,223 | 11.93 % | 54 | 1.37 | 0.84 |
| Colorado | 5,773,714 | 1.74 % | 10 | 1.73 | 1.07 |
| Connecticut | 3,605,944 | 1.09 % | 7 | 1.94 | 1.20 |
| Delaware | 989,948 | 0.30 % | 3 | 3.03 | 1.87 |
| District of Columbia | 689,545 | 0.21 % | 3 | 4.35 | 2.68 |
| Florida | 21,538,187 | 6.50 % | 30 | 1.39 | 0.86 |
| Georgia | 10,711,908 | 3.23 % | 16 | 1.49 | 0.92 |
| Hawaii | 1,455,271 | 0.44 % | 4 | 2.75 | 1.69 |
| Idaho | 1,839,106 | 0.55 % | 4 | 2.17 | 1.34 |
| Illinois | 12,812,508 | 3.87 % | 19 | 1.48 | 0.91 |
| Indiana | 6,785,528 | 2.05 % | 11 | 1.62 | 1.00 |
| Iowa | 3,190,369 | 0.96 % | 6 | 1.88 | 1.16 |
| Kansas | 2,937,880 | 0.89 % | 6 | 2.04 | 1.26 |
| Kentucky | 4,505,836 | 1.36 % | 8 | 1.78 | 1.09 |
| Louisiana | 4,657,757 | 1.41 % | 8 | 1.72 | 1.06 |
| Maine | 1,362,359 | 0.41 % | 4 | 2.94 | 1.81 |
| Maryland | 6,177,224 | 1.86 % | 10 | 1.62 | 1.00 |
| Massachusetts | 7,029,917 | 2.12 % | 11 | 1.56 | 0.96 |
| Michigan | 10,077,331 | 3.04 % | 15 | 1.49 | 0.92 |
| Minnesota | 5,706,494 | 1.72 % | 10 | 1.75 | 1.08 |
| Mississippi | 2,961,279 | 0.89 % | 6 | 2.03 | 1.25 |
| Missouri | 6,154,913 | 1.86 % | 10 | 1.62 | 1.00 |
| Montana | 1,084,225 | 0.33 % | 4 | 3.69 | 2.27 |
| Nebraska | 1,961,504 | 0.59 % | 5 | 2.55 | 1.57 |
| Nevada | 3,104,614 | 0.94 % | 6 | 1.93 | 1.19 |
| New Hampshire | 1,377,529 | 0.42 % | 4 | 2.90 | 1.79 |
| New Jersey | 9,288,994 | 2.80 % | 14 | 1.51 | 0.93 |
| New Mexico | 2,117,522 | 0.64 % | 5 | 2.36 | 1.45 |
| New York | 20,201,249 | 6.09 % | 28 | 1.39 | 0.85 |
| North Carolina | 10,439,388 | 3.15 % | 16 | 1.53 | 0.94 |
| North Dakota | 779,094 | 0.24 % | 3 | 3.85 | 2.37 |
| Ohio | 11,799,448 | 3.56 % | 17 | 1.44 | 0.89 |
| Oklahoma | 3,959,353 | 1.19 % | 7 | 1.77 | 1.09 |
| Oregon | 4,237,256 | 1.28 % | 8 | 1.89 | 1.16 |
| Pennsylvania | 13,002,700 | 3.92 % | 19 | 1.46 | 0.90 |
| Rhode Island | 1,097,379 | 0.33 % | 4 | 3.65 | 2.25 |
| South Carolina | 5,118,425 | 1.54 % | 9 | 1.76 | 1.08 |
| South Dakota | 886,667 | 0.27 % | 3 | 3.38 | 2.08 |
| Tennessee | 6,910,840 | 2.09 % | 11 | 1.59 | 0.98 |
| Texas | 29,145,505 | 8.79 % | 40 | 1.37 | 0.85 |
| Utah | 3,271,616 | 0.99 % | 6 | 1.83 | 1.13 |
| Vermont | 643,077 | 0.19 % | 3 | 4.67 | 2.87 |
| Virginia | 8,631,393 | 2.60 % | 13 | 1.51 | 0.93 |
| Washington | 7,705,281 | 2.32 % | 12 | 1.56 | 0.96 |
| West Virginia | 1,793,716 | 0.54 % | 4 | 2.23 | 1.37 |
| Wisconsin | 5,893,718 | 1.78 % | 10 | 1.70 | 1.05 |
| Wyoming | 576,851 | 0.17 % | 3 | 5.20 | 3.20 |
| Total U.S. | 331,449,281 | 100.00 % | 538 | 1.62 | 1.00 |
I’ve included the District of Columbia in the table because after the 23rd Amendment to the Constitution was ratified in 1961, the citizens in the District of Columbia were allowed to participate in Presidential elections with a “number of electors of President and Vice President equal to the whole number of Senators and Representatives in Congress to which the District would be entitled if it were a State, but in no event more than the least populous State.” The District of Columbia has no voting representation in Congress but for Presidential elections, they have 3 electors.
I am very sad that this table excludes Puerto Rico and the other territories of the United States: American Samoa, Guam, Northern Mariana Islands, and United States Virgin Islands. Although the residents of these territories are United States citizens, they are prohibited from voting for President. Despite the fact that the population of Puerto Rico is greater than 22 states — despite the fact that the population of Puerto Rico is greater than the populations of Wyoming, Washington D.C., Vermont, and Alaska combined — the United States citizens who reside in Puerto Rico have no representation in Congress, and they are disenfranchised in the Presidential election.
But I digress.
You can sort the table alphabetically by state or numerically by population by clicking the arrow icons on the first two columns. Most illuminating is to sort by population. You can then see that the lowest population state has 5.20 electors per million of population while the highest population state has only 1.37. This results in a Relative Electoral Strength ranging from 3.20 to 0.84. What this means is that a resident of Wyoming has 3.8 times the power to choose a President than a resident of California.
Another way to look at this is that when compared with Wyoming, almost three out of every four residents of California are effectively disenfranchised by the Electoral College. Or, when compared with the country has a whole, the citizens of Wyoming exceed the one-person-one-vote rule by one-person-3.2-votes.
If the Electoral College were not mandated by the United States Constitution, it would be considered unconstitutional. As it is, it can only be replaced by a Constitutional Amendment, which unfortunately is quite unlikely.
Of course, advocates of federalism believe that the lopsidedness of the Electoral College is not a bug but a feature. But the principles of federalism are already embodied quite effectively in the United States Senate, in which each state regardless of its size is represented by two senators. The President, however, should not be representing the states but the people. There can never be a President favored by all Americans, but the least we can do is select a President by the majority of Americans.
A direct vote for President would also eliminate the racial bias built into the Electoral College.
How Race was Tabulated in the 2020 Census
Race is not a biological concept. It has no taxonomic significance. This world is home to three species of elephants, eight species of bears, forty species of dolphins, but only one species of humans.
Race is instead a social and cultural construct based on relatively insignificant physical characteristics associated with geographic ancestral origins. Optimally, we shouldn’t take account of race at all in our dealings with others, and someday we might ignore race altogether. However, a long history of racism has resulted in profound differences in standards of living related to race. Many vital statistics — including mortality, morbidity, income, wealth, housing, and educational and occupational opportunities — show notable differences by race. Ignoring race entirely in analyzing social phenomena would have the counter-productive effect of masking persistent racial injustices.
For this reason, information about race has continued to be included among the information solicited by our country’s decennial census. A recent New York Times article, “An American Puzzle: Fitting Race in a Box” explored how this information has changed over the centuries.
As you might remember (or as can see by examining a sample 2020 census form), ethnicity and race were most recently handled in two separate questions: For Person 1 in the household, it was questions 8 and 9; for other persons in the household, these were questions 6 and 7. Here’s the portion of that page containing those questions:

As the census form notes, Spanish descent is not considered a racial category. However, immigration from Mexico, Latin America. and U.S. territories such as Puerto Rico, has resulted in a significant and important Hispanic or Latino population. Also notice that in Question 9, more than one box can be checked based on how the individual self-identifies with these racial categories.
Obviously, summarizing and tabulating this information was challenging for the Census Bureau, and using this information is challenging as well.
When I wrote my blog entry on this subject four years ago, I took advantage of a shortcut. My source for population data was Table 11 in a 2010 Census Brief “Overview of Race and Hispanic Origin: 2010.” For each state, Table 11 shows the total state population, the population of a category labeled Non-Hispanic White alone and the population of a category labeled Minority, which is defined in a footnote as “people who reported their ethnicity and race as something other than non-Hispanic White alone.,” in other words, those who checked only one box in the section on race. The term “minority” is convenient but not ideal, not least because in several states, this category accounts for more than half the population!
I could not find the equivalent of that 2010 Census Brief updated to 2020. Instead, I found several tables that provided much more detailed population data by race. For my purpose, the most useful tabulations on the census.gov website are four separate tables that are labeled P1, P2, P3, and P4. Each of these tables shows population data by state and racial category:
Census Table P1
This table shows the total population in each state, and the state populations for numerous racial categories based on the census tabulations. This table ignores information about Hispanic or Latino origin. The racial categories are indicated by labels in the leftmost column. Data are shown for those who selected just one racial classification, and for those who selected two, three, four, five, and six classifications, resulting in quite a lot of information.
Here is a section of Table P1 showing the population data for Alabama and Alaska (the first two states alphabetically) when the table is almost entirely collapsed except for those who classified themselves as being of only one race:
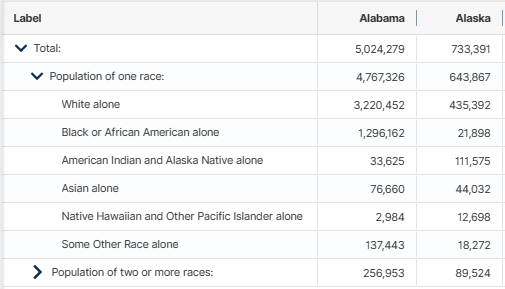
You’ll see that the total populations of Alabama and Alaska agree with my earlier table that shows the population of each state. This is my source of population for those figures. The category White alone refers to people who answered the race question on the census form by checking only the White box. Similarly, the Black or African American alone category are those people who checked only the Black or African Am. box. Those who checked multiple boxes are tabulated in subcategories under the heading Population of two or more races.
Census Table P2
This table is similar in structure to Table P2. For each state, the top row shows the state’s total population, which agrees with Table P1. The second row shows the total Hispanic or Latino population for each state. The next row is labeled Not Hispanic or Latino, which is then divided into the same racial categories as Table P1.
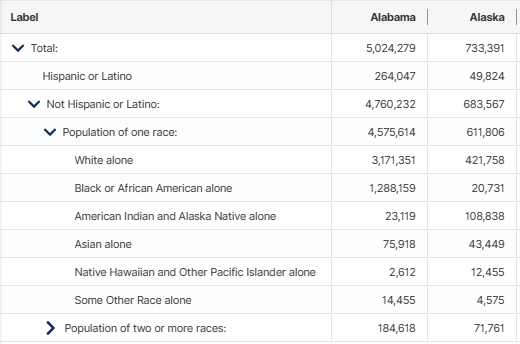
Table P2 does not divide the Hispanic or Latino category by race. However, those numbers can be derived by taking differences between Tables P1 and P2 for the various racial categories. For example, the number of Alabamians who identify as Hispanic or Latino and White alone is the White alone population in Table P1 (3,220,452) minus the Not Hispanic or Latino and White alone population in Table P2 (3,171,351).
Census Table P3
This is the same as Table P1 except restricted to ages 18 and over. This table is more appropriate for examining populations of people of voting age.
Census Table P4
This is the same as Table P2 except restricted to ages 18 and over.
Analyzing the Census Data
At first, my only goal was to update the results I showed in my earlier blog entry, which involves dividing the population between those who identified as not Hispanic or Latino and as White. These figures are obtained from Table P2, the 5th line under the headings. In the excerpt shown above, the populations of this group for Alabama and Alaska are 3,171,351 and 421,758. The Minority population in each state is then calculated by subtracting those numbers from the total population in each state. These three populations became the 2nd, 3rd, and 5th columns in the following table:
| State | Total Population | Non-Hispanic White | Percentage Non-Hispanic White | Minority | Percentage Minority | Electors | Non-Hispanic White Electors | Minority Electors |
|---|---|---|---|---|---|---|---|---|
| Alabama | 5,024,279 | 3,171,351 | 63.12 % | 1,852,928 | 36.88 % | 9 | 5.681 | 3.319 |
| Alaska | 733,391 | 421,758 | 57.51 % | 311,633 | 42.49 % | 3 | 1.725 | 1.275 |
| Arizona | 7,151,502 | 3,816,547 | 53.37 % | 3,334,955 | 46.63 % | 11 | 5.870 | 5.130 |
| Arkansas | 3,011,524 | 2,063,550 | 68.52 % | 947,974 | 31.48 % | 6 | 4.111 | 1.889 |
| California | 39,538,223 | 13,714,587 | 34.69 % | 25,823,636 | 65.31 % | 54 | 18.731 | 35.269 |
| Colorado | 5,773,714 | 3,760,663 | 65.13 % | 2,013,051 | 34.87 % | 10 | 6.513 | 3.487 |
| Connecticut | 3,605,944 | 2,279,232 | 63.21 % | 1,326,712 | 36.79 % | 7 | 4.425 | 2.575 |
| Delaware | 989,948 | 579,851 | 58.57 % | 410,097 | 41.43 % | 3 | 1.757 | 1.243 |
| District of Columbia | 689,545 | 261,771 | 37.96 % | 427,774 | 62.04 % | 3 | 1.139 | 1.861 |
| Florida | 21,538,187 | 11,100,503 | 51.54 % | 10,437,684 | 48.46 % | 30 | 15.462 | 14.538 |
| Georgia | 10,711,908 | 5,362,156 | 50.06 % | 5,349,752 | 49.94 % | 16 | 8.009 | 7.991 |
| Hawaii | 1,455,271 | 314,365 | 21.60 % | 1,140,906 | 78.40 % | 4 | 0.864 | 3.136 |
| Idaho | 1,839,106 | 1,450,523 | 78.87 % | 388,583 | 21.13 % | 4 | 3.155 | 0.845 |
| Illinois | 12,812,508 | 7,472,751 | 58.32 % | 5,339,757 | 41.68 % | 19 | 11.082 | 7.918 |
| Indiana | 6,785,528 | 5,121,004 | 75.47 % | 1,664,524 | 24.53 % | 11 | 8.302 | 2.698 |
| Iowa | 3,190,369 | 2,638,201 | 82.69 % | 552,168 | 17.31 % | 6 | 4.962 | 1.038 |
| Kansas | 2,937,880 | 2,122,575 | 72.25 % | 815,305 | 27.75 % | 6 | 4.335 | 1.665 |
| Kentucky | 4,505,836 | 3,664,764 | 81.33 % | 841,072 | 18.67 % | 8 | 6.507 | 1.493 |
| Louisiana | 4,657,757 | 2,596,702 | 55.75 % | 2,061,055 | 44.25 % | 8 | 4.460 | 3.540 |
| Maine | 1,362,359 | 1,228,264 | 90.16 % | 134,095 | 9.84 % | 4 | 3.606 | 0.394 |
| Maryland | 6,177,224 | 2,913,782 | 47.17 % | 3,263,442 | 52.83 % | 10 | 4.717 | 5.283 |
| Massachusetts | 7,029,917 | 4,748,897 | 67.55 % | 2,281,020 | 32.45 % | 11 | 7.431 | 3.569 |
| Michigan | 10,077,331 | 7,295,651 | 72.40 % | 2,781,680 | 27.60 % | 15 | 10.859 | 4.141 |
| Minnesota | 5,706,494 | 4,353,880 | 76.30 % | 1,352,614 | 23.70 % | 10 | 7.630 | 2.370 |
| Mississippi | 2,961,279 | 1,639,077 | 55.35 % | 1,322,202 | 44.65 % | 6 | 3.321 | 2.679 |
| Missouri | 6,154,913 | 4,663,907 | 75.78 % | 1,491,006 | 24.22 % | 10 | 7.578 | 2.422 |
| Montana | 1,084,225 | 901,318 | 83.13 % | 182,907 | 16.87 % | 4 | 3.325 | 0.675 |
| Nebraska | 1,961,504 | 1,484,687 | 75.69 % | 476,817 | 24.31 % | 5 | 3.785 | 1.215 |
| Nevada | 3,104,614 | 1,425,952 | 45.93 % | 1,678,662 | 54.07 % | 6 | 2.756 | 3.244 |
| New Hampshire | 1,377,529 | 1,200,649 | 87.16 % | 176,880 | 12.84 % | 4 | 3.486 | 0.514 |
| New Jersey | 9,288,994 | 4,816,381 | 51.85 % | 4,472,613 | 48.15 % | 14 | 7.259 | 6.741 |
| New Mexico | 2,117,522 | 772,952 | 36.50 % | 1,344,570 | 63.50 % | 5 | 1.825 | 3.175 |
| New York | 20,201,249 | 10,598,907 | 52.47 % | 9,602,342 | 47.53 % | 28 | 14.691 | 13.309 |
| North Carolina | 10,439,388 | 6,312,148 | 60.46 % | 4,127,240 | 39.54 % | 16 | 9.674 | 6.326 |
| North Dakota | 779,094 | 636,160 | 81.65 % | 142,934 | 18.35 % | 3 | 2.450 | 0.550 |
| Ohio | 11,799,448 | 8,954,135 | 75.89 % | 2,845,313 | 24.11 % | 17 | 12.901 | 4.099 |
| Oklahoma | 3,959,353 | 2,407,188 | 60.80 % | 1,552,165 | 39.20 % | 7 | 4.256 | 2.744 |
| Oregon | 4,237,256 | 3,036,158 | 71.65 % | 1,201,098 | 28.35 % | 8 | 5.732 | 2.268 |
| Pennsylvania | 13,002,700 | 9,553,417 | 73.47 % | 3,449,283 | 26.53 % | 19 | 13.960 | 5.040 |
| Rhode Island | 1,097,379 | 754,050 | 68.71 % | 343,329 | 31.29 % | 4 | 2.749 | 1.251 |
| South Carolina | 5,118,425 | 3,178,552 | 62.10 % | 1,939,873 | 37.90 % | 9 | 5.589 | 3.411 |
| South Dakota | 886,667 | 705,583 | 79.58 % | 181,084 | 20.42 % | 3 | 2.387 | 0.613 |
| Tennessee | 6,910,840 | 4,900,246 | 70.91 % | 2,010,594 | 29.09 % | 11 | 7.800 | 3.200 |
| Texas | 29,145,505 | 11,584,597 | 39.75 % | 17,560,908 | 60.25 % | 40 | 15.899 | 24.101 |
| Utah | 3,271,616 | 2,465,355 | 75.36 % | 806,261 | 24.64 % | 6 | 4.521 | 1.479 |
| Vermont | 643,077 | 573,201 | 89.13 % | 69,876 | 10.87 % | 3 | 2.674 | 0.326 |
| Virginia | 8,631,393 | 5,058,363 | 58.60 % | 3,573,030 | 41.40 % | 13 | 7.619 | 5.381 |
| Washington | 7,705,281 | 4,918,820 | 63.84 % | 2,786,461 | 36.16 % | 12 | 7.660 | 4.340 |
| West Virginia | 1,793,716 | 1,598,834 | 89.14 % | 194,882 | 10.86 % | 4 | 3.565 | 0.435 |
| Wisconsin | 5,893,718 | 4,634,018 | 78.63 % | 1,259,700 | 21.37 % | 10 | 7.863 | 2.137 |
| Wyoming | 576,851 | 469,664 | 81.42 % | 107,187 | 18.58 % | 3 | 2.443 | 0.557 |
| Total U.S. | 331,449,281 | 191,697,647 | 57.84 % | 139,751,634 | 42.16 % | 538 | 319.099 | 218.901 |
The 4th and 6th column show the percentage of the populations of the two racial groups in each state. The table is sortable by any of these columns.
The Electors column shows the number of electors in each state, which is the same as the previous table. The final two column then divide the electors into Non-Hispanic White Electors and Minority Electors based on the percentages of those voters in each state.
This technique might seem odd at first. In most states (with two exceptions), all the state’s electors go to the candidate who gets a plurality of votes in that state, so it might not seem quite legitimate to divide the electors into two groups like this. It’s also quite obvious that individuals of particular races don’t vote in the same way.
Instead, this division of a state’s electors measures the extent to which the collective votes of individuals in these groups can affect the allocation of those electors. In a state whose population is divided equally between two groups, neither group has any intrinsic advantage over the other. If the split is instead 75% / 25% of the population, then the 75% group has a better (although not absolute) advantage in their collective political power. In my type of analysis, those two groups would be associated with 75% and 25% of the state’s electoral votes to reflect that difference.
The fractional electors in the final two columns are totaled. These are weighted averages of the electors in each state based on the population of the two racial groups. The results are summarized here:
| Population | Apportioned Electors | Electors per Million of Population | Relative Electoral Strength | |
|---|---|---|---|---|
| Non-Hispanic White: | 191,697,647 | 319.1 | 1.665 | 1.026 |
| Minority: | 139,751,634 | 218.9 | 1.566 | 0.965 |
| Total U.S.: | 331,449,281 | 538.0 | 1.623 | 1.000 |
The values in the Electors per Million of Population are calculated by dividing Apportioned Electors by Population divided by a million. The Relative Electoral Strength is the Electors per Million of Population divided by that same value for the Total United States.
This is very similar to the results I got four years ago based on populations from the 2010 census. The Relative Electoral Strength of 1.026 for non-Hispanic White and 0.965 for minority voters might not seem like much, but it means that 17 minority voters are required to achieve the same electoral influence as 16 non-Hispanic White voters.
Where did I get those numbers of 16 and 17 voters? I tried a few possibilities and found that 16 and 17 to come closest to satisfying the following formula where the number of voters are multiplied by the respective Relative Electoral Strength values:
You can also derive these number of voters by taking the multiplicative inverse of the difference between the two electoral strengths:
The two integers that surround 16.4 are 16 and 17.
That difference of 6.1% between the two Relative Electoral Strength values might be termed an Electoral Advantage, and it’s handy for determining how many voters of one group are necessary to balance the votes of another group.
But let’s derive an Electoral Advantage more formally. Suppose the population is divided into two groups with a greater Relative Electoral Strength value of and a lesser value of . We want to determine a number of people to balance these strengths. Here the two Relative Electoral Strength values are multiplied by :
This can be then be solved for :