The Dawn of the Sinusoid
April 8, 2017
Roscoe, NY
I’ve been thinking about sine curves recently. The gently undulating pattern of the sinusoid is one of the most familiar mathematical images, but how long has that been the case? Who were the first people to see this curve? Who was the first person to draw it?
I've been thinking about sine curves a lot because of a book I've been working on. During weekends and other days off I've been writing a book tentatively entitled Computer of the Tides about an early analog computer, the tide-predicting machine created by William Thomson (Lord Kelvin):
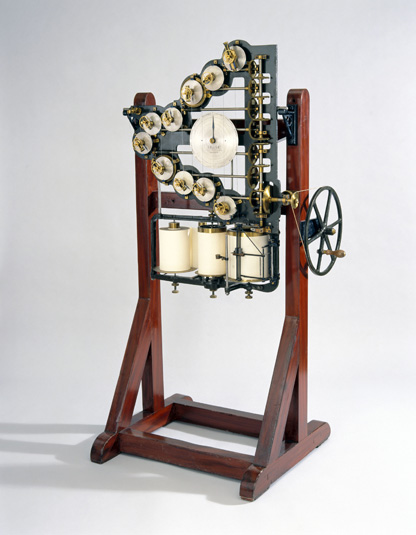
Sine curves play a crucial role in this machine. The harmonic theory of the tides developed by Thomson requires accumulating data from tide gauges for a particular seaport, which are then subjected to Fourier analysis to break down the rise and fall patterns into constituent sine curves. The tide-predicting machine is then “programmed” with the amplitude, frequency, and phases of these sine curves. The machine shown above from the South Kensington Science Museum can be set up for 10 sine curves corresponding to the 10 smaller wheels. Crank the big wheel at the right, and these ten sine curves are summed up to plot the future rise and fall of the tides.
I’m sure that many high school students believe that trigonometry was invented solely for purposes of torture, but it’s actually one of the most utilitarian branches of mathematics.
The first major use of trigonometry was in measuring angles and distances. This goes back to the ancient Greeks, Egyptians, and Babylonians, primarily for astronomy. The first extent table of trigonometric values can be found in the Almagest of Claudius Ptolemy, which formed the basis of astronomy until the Copernican Revolution. The position of every celestial object in the sky is measured in terms of angles, and spherical trigonometry is also used for the measurement of longitude and latitude in terrestrial navigation. GPS makes extensive use of trigonometry.
At some point, trigonometry was also discovered to have a second big application in the analysis of oscillations, or harmonic motion. The classic physics textbook example is a weight dangling on a spring. As the weight bobs up and down, it maps out a sine curve. Today, trigonometry is extensively used in waveform analysis. Without trigonometry, compression techniques such as JPEG, MPEG, and MP3 would be impossible.
This second application of trigonometry was discovered much later than the first. Until that time, there was no reason for anyone to draw a sine curve, or to think of sines and cosines as representing a sort of continuous function that might be interesting in itself.
It seems to me that understanding the historical development of applying trigonometry to oscillation also involves determining when mathematicians started talking about sine curves or sine waves, and also began visualizing the familiar sinusoid.
That started me on my quest to determine when this was.
The Oxford English Dictionary was of no use. The first occurrence of “sine wave” is indicated with an 1893 source and the first use of “sinusoid” is from 1823. Those dates are much too late.
I tried Google Book Search for “sine curve”, “sine wave”, and “sinusoid” with date restrictions, and didn’t have much luck there either.
In JSTOR, however, searching around for keywords I thought might be in relevant journal article titles, I came upon a 1947 article by Carl B. Boyer in The Mathematics Teacher entitled “History of the Derivative and Integral of the Sine”. I knew the name Carl Boyer as the author of A History of Mathematics, our text in a college course on the subject. (You can get access to this article through the free My JSTOR service or at a public library that subscribes to JSTOR.)
According to Boyer, “a portion of the sine curve appears for the first time in history” about 1635 in an article by Gilles de Roberval, a French mathematician who experimented with pre-calculus techniques in curve analysis. However, Roberval provided an illustration only of the first quarter of a complete sine curve. For a while, this was known as “Roberval’s curve.”
Boyer seemingly anticipated exactly what I was searching for with this statement:
“The first clear-cut recognition of trigonometric periodicities seems to be that of [English mathematician John] Wallis in his Mechanica of 1670. Here two full cycles of the sine curve are clearly drawn; and the periodicity is evidenced by an accompanying statement that the sine curve increases throughout the first, fourth, eighth, ninth quadrants, and so forth.”
Boyer’s footnote refers to John Wallis’s Opera, which is three volumes of his collected works published between 1693 and 1699, but on Google Book Search it was easier finding four copies of the original Mechanica:
https://books.google.com/books?id=YbQWAAAAQAAJ
https://books.google.com/books?id=vGo_AAAAcAAJ
https://books.google.com/books?id=VjGt_QOkT6sC
https://books.google.com/books?id=aWgJ0rx7X5UC
To access the full text of the book, click "Preview this book."
The sine curve is labeled as Figure 201 in Mechanica, and is referenced on pages 504 and 505 of the Latin text. However, all the illustrations in this book are apparently fold-out pages at the end of the book, and these have generally not been reproduced very well.
For example, in the copy of the book referenced by the first of the four links, if you scroll to the very end, and then scroll back a few pages, you can see the diagrams, but they are on folded sheets and have not been unfolded for reproduction.
The copy of Mechanica available from the second link has no diagrams at all that I can find, and in the third one they are water-stained and very faint. The fourth copy, however, seems to have been handled by someone who know what he or she was doing. The illustrations are excellent (considering that they're 347 years old). Here’s the page with the sine curve:
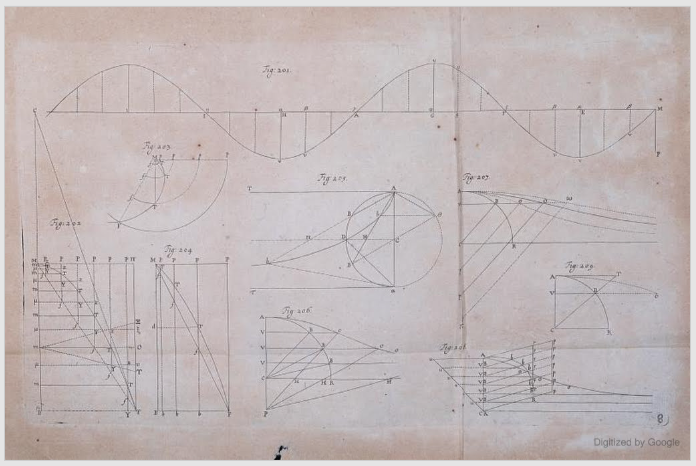
Gorgeous, isn't it?
Of course, if you're aware of any appearances of a sine curve in print prior to 1670, please let me know at cp@charlespetzold.com
ADDENDUM (later that same day):
Boyer's footnote for the source of Wallis's illustration of two cycles of the sine curve reads:
"John Wallis, Opera (3 vols., Oxonii, 1693-1699), I, 504-505 and figure 201 opposite page 542."
However, the page numbers 504-505 refer to the original reference in Mechanica rather than the reprint in Opera. After using Google Book Search some more, I found the illustration in an Opera volume dated 1695, but on page 883, where the sine curve is printed on its side on the same page as the accompanying text.